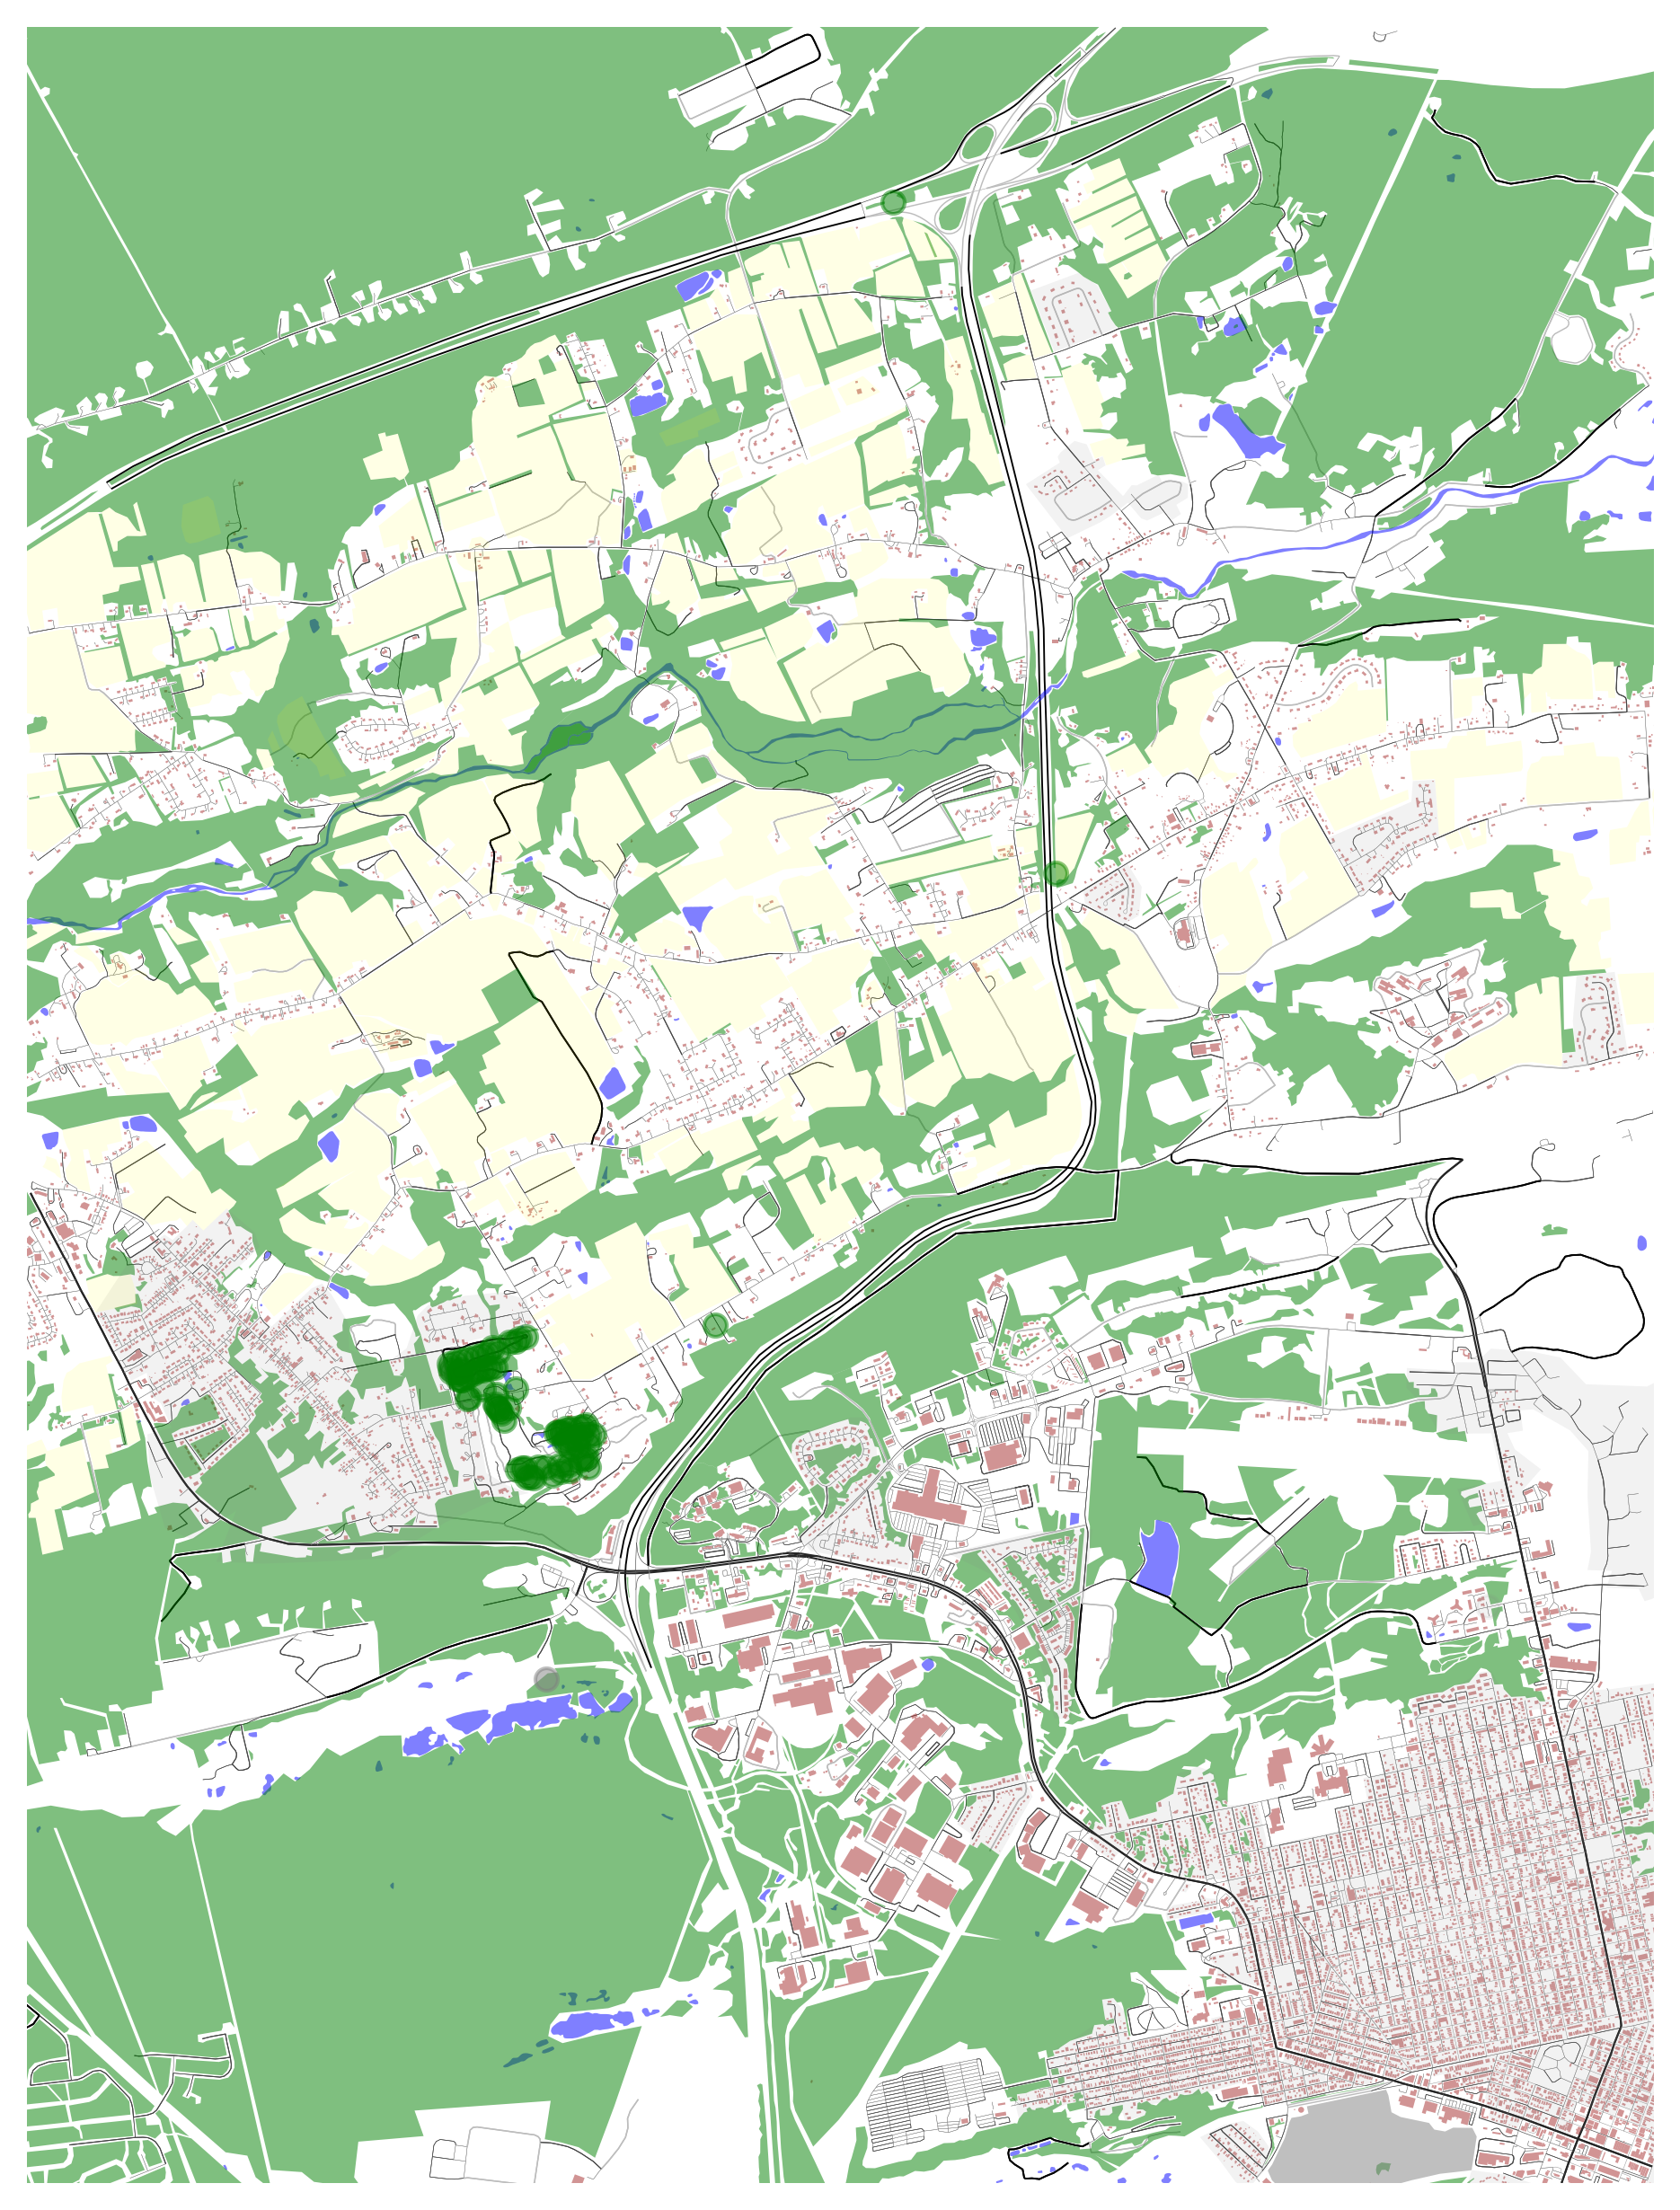
In [1]:
import osmnx as ox
import matplotlib.pyplot as plt

#Center of the map  
latitude = 41.0028
longitude = -76.0224

#Limit borders 
north = latitude + 0.05
south = latitude - 0.05
east = longitude + 0.05
west = longitude - 0.05

bbox = north, south, east, west
place = ["Hazleton, Pensylvania"]

G = ox.graph_from_bbox(north, south, east, west, retain_all=True, simplify = True, network_type='all')
fig, ax = ox.plot_graph(ox.project_graph(G))
In [2]:
naturaltags = {'natural': True}
natural = ox.geometries_from_bbox(north, south, east, west, naturaltags)
len(natural)
#natural.head(3)
fig, ax = ox.plot_footprints(natural, color="black", bgcolor='white')
In [3]:
natural["natural"].value_counts()
Out[3]:
wood         566
tree         187
water        182
sand          78
tree_row      77
wetland       40
scrub         20
grassland      7
grass          2
peak           1
scree          1
ridge          1
Name: natural, dtype: int64
In [4]:
Woods = natural[natural["natural"].isin(["wood"])]
Woods.plot(color="green")
Out[4]:
<AxesSubplot:>
In [5]:
Water = natural[natural["natural"].isin(["water"])]
Water.plot(color="blue")
Out[5]:
<AxesSubplot:>
In [6]:
landusetags = {'landuse': True}
landuse = ox.geometries_from_bbox(north, south, east, west, landusetags)
fig, ax = ox.plot_footprints(landuse,color="black", bgcolor='white')
In [7]:
landuse["landuse"].value_counts()
Out[7]:
farmland             202
grass                 95
meadow                29
farmyard              19
residential           18
orchard                9
cemetery               8
commercial             5
recreation_ground      5
industrial             4
forest                 4
flowerbed              3
plant_nursery          3
quarry                 2
landfill               1
animal_keeping         1
mine                   1
Name: landuse, dtype: int64
In [9]:
Farmland = landuse[landuse["landuse"].isin(["farmland","farmyard"])]
Farmland.plot(color="brown")
Out[9]:
<AxesSubplot:>
In [10]:
Residental = landuse[landuse["landuse"].isin(["residential"])]
Residental.plot(color="blue")
Out[10]:
<AxesSubplot:>
In [11]:
Mining = landuse[landuse["landuse"].isin(["mine","landfill"])]
Mining.plot(color="blue")
Out[11]:
<AxesSubplot:>
In [12]:
buildingtags = {'building': True}
building = ox.geometries_from_bbox(north, south, east, west, buildingtags)
len(building)
fig, ax = ox.plot_footprints(building, color="black", bgcolor='white')
In [13]:
###############################################################################
#                               4. Unpack Data                                #
###############################################################################
u = []
v = []
key = []
data = []
for uu, vv, kkey, ddata in G.edges(keys=True, data=True):
    u.append(uu)
    v.append(vv)
    key.append(kkey)
    data.append(ddata)  
In [14]:
# Lists to store colors and widths 
roadColors = []
roadWidths = []

for item in data:
    if "length" in item.keys():
        if item["length"] <= 100:
            linewidth = 0.10
            color = "#858585" 
            
        elif item["length"] > 100 and item["length"] <= 200:
            linewidth = 0.15
            color = "#474747"
            
        elif item["length"] > 200 and item["length"] <= 400:
            linewidth = 0.25
            color = "#454545"
            
        elif item["length"] > 400 and item["length"] <= 800:
            color = "#bdbdbd"
            linewidth = 0.35
        else:
            color = "#000000"
            linewidth = 0.45

        if "primary" in item["highway"]:
            linewidth = 0.5
            color = "#262626"
    else:
        color = "#4d4d4d"
        linewidth = 0.10
            
    roadColors.append(color)
    roadWidths.append(linewidth)
In [15]:
for item in data:
    if "footway" in item["highway"]:
        color = "#ededed"
        linewidth = 0.25
    else:
        color = "#a6a6a6"
        linewidth = 0.5
        
    roadWidths.append(linewidth)
In [27]:
bgcolor = "white"

fig, ax = ox.plot_graph(G, node_size=0, bbox = (north, south, east, west),
                        dpi = 300,bgcolor = bgcolor,
                        save = False, edge_color=roadColors,
                        edge_linewidth=roadWidths, edge_alpha=1)
building.plot(ax=ax, color='brown', alpha=0.5)
Water.plot(ax=ax, color='blue', alpha=0.5)
Woods.plot(ax=ax, color='green', alpha=0.5)
Mining.plot(ax=ax, color='gray', alpha=0.5)
Residental.plot(ax=ax, color='grey', alpha=0.1)
Farmland.plot(ax=ax, color='yellow', alpha=0.1)

fig.tight_layout(pad=0)
fig.savefig("map.png", dpi=300, bbox_inches='tight', format="png", 
            facecolor=fig.get_facecolor(), transparent=False)

This is the End Result

In [ ]: